
Troubleshooting venue networks on event day
Stadiums, arenas and convention centres run ticket scanners, walk-through scanners, point of sale and a wireless controller with thousands of clients on one network, and the faults tend to appear at the worst moment: minutes before doors. This guide is a practical playbook for using MobiObs on a mobile device to see what that equipment is reporting while you walk the building.
MobiObs is not released yet. It is coming to Google Play first, then the App Store and desktop. Join the launch list to get one email when it is available.
The event-day timeline
Venue problems follow the event schedule, and each phase stresses something different:
- Load-in. Production, broadcast and vendor kit are patched in. New devices appear on the network, and temporary cabling and switch ports change. This is the time to set up collection, while nobody is queuing.
- Doors. Scanners that have been idle start validating tickets at once, point of sale opens, and staff devices join the Wi-Fi together.
- Ingress peak. The highest scanner and authentication load of the day. A slow validation API, a saturated uplink or an exhausted DHCP scope shows up here first, as queues at a gate.
- Egress. Clients roam and leave in a wave. Controller logs fill with roaming and disassociation, which is normal, and useful as a baseline for next time.
Where to put the device
The collector has to be reachable from the equipment. That rules out guest and public SSIDs, where client isolation stops devices on the same SSID from reaching one another. Good choices are a staff or operations SSID without isolation, a management VLAN, or a wired port through a USB-C Ethernet adapter where the device supports one. If the device sits on a different subnet, make sure the scanner and controller VLANs are routed to it and that no ACL drops UDP to the collector ports.
The Network screen in MobiObs shows the address, gateway and Wi-Fi details the device is using, and the exact URLs to give to each sender.
What to send, and why
| Source | Send | Answers |
|---|---|---|
| Wireless controller | Syslog udp/5514, traps udp/1162 | 802.1X and PSK failures, roaming, AP reboots, RF events |
| Scanner application or its server | Syslog udp/5514 | Validation results, API timeouts, duplicate scans |
| Core and access switches | Syslog, traps | Link flaps, PoE faults, spanning-tree changes |
| Border router or firewall | NetFlow udp/2055 or sFlow udp/6343 | Uplink use, top talkers, traffic to the ticketing and payment APIs |
| FortiGate or similar | Syslog as CEF | Denied sessions, policy hits, VPN state |
Configuration lines for each platform are in the vendor guides: Cisco, Aruba, Fortinet, Juniper and MikroTik. A single logging host added on each device is enough, and removing it after the event restores the original configuration.
Telling the usual faults apart
"The scanners are slow" can have several causes, and each leaves a different trace:
- Validation API timeouts. Scanner logs show timeouts to one address and port, while the Wi-Fi logs look normal and scanners stay associated. Check flows to that API: if traffic leaves but responses are slow, the problem is upstream of the venue.
- 802.1X or PSK failures. The controller logs authentication failures for scanner MAC addresses, and the scanners drop off the network. Look for a RADIUS server that is unreachable or slow, or an expired certificate.
- Uplink flaps.
linkDownandlinkUptraps and%LINK-3-UPDOWNmessages from one switch, lined up in time with a gate's scanners going quiet. - DHCP scope exhaustion. Clients associate but never get an address. Syslog from the DHCP server or firewall reports no free leases, and flows from the new clients never appear.
Because syslog, traps and flows share one timeline on the device, you can see which of these happened first, which is usually the question that matters.
Watching it live
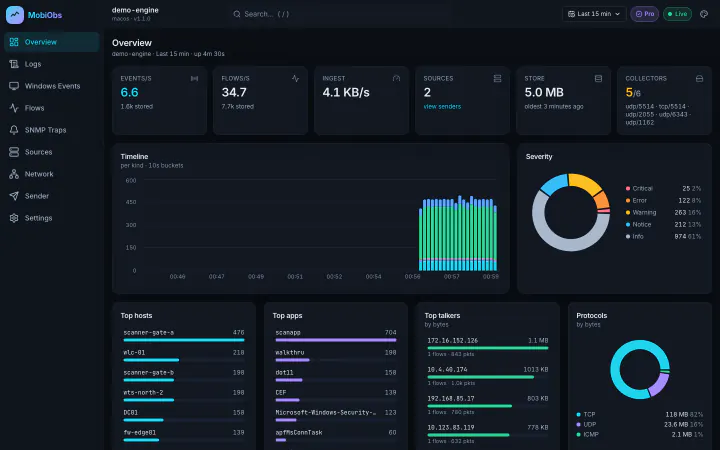
Overview shows event and flow rates, the severity split and the top hosts, so a gate that has gone quiet or a controller that has suddenly become noisy stands out. The same dashboards are served on port 8080, or HTTPS on 8443, so you can put them on a NOC screen or a colleague's laptop while you carry the device to the gate. Browsers pair with the token shown in the app.
Before blaming a scanner or controller, prove the path. Sender mode on a second MobiObs device sends test syslog, flows or traps from the same VLAN as the equipment. If those arrive, the network path works and the problem is in the equipment configuration.
Practical caveats
- Android runs the collectors as a foreground service, so collection continues with the screen off. Exempt MobiObs from battery optimisation for a full event.
- iPhone and iPad suspend background apps, and a suspended app receives no UDP. Keep MobiObs in the foreground and set Auto-Lock to Never.
- Retention. The Free tier keeps one hour. For a whole event day, Pro makes retention configurable and lets you export the evidence for the post-event review.